 English
资源说明:A wrapper around Microsoft Chart Control for Windows Forms, with an easy to use API
# MSChartWrapper: A Wrapper Around Microsoft Chart Control for Win32
This repository contains a component library and a sample UI application for *MSChartWrapper*. If you wish to create a simple line-chart or column-chart but do not want to dive into the API for Microsoft Chart Control, this is for you.
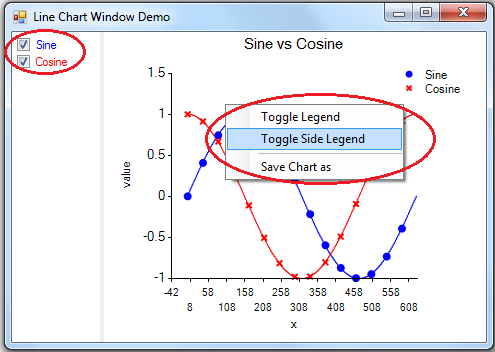
In terms of UI, it adds a side-legend with check-boxes, so that you can choose what series to show and what series to hide. It also adds a context menu to the chart area so that one can easily show or hide chart legends, and save the plot to an image file. It also supports saving a plot to a Matlab `.m` file.
It may not be too much at the UI side, but at the API side one can easily plot a series with a few function calls:
// retrieve the series values from somewhere
double[] ser1 = GetFirstSeriesValues();
double[] ser2 = GetSecondSeriesValues();
// now plot them
chartWrapperObj.AddLinePlot("First Series", ser1);
chartWrapperObj.AddLinePlot("Second Series", ser2);
This is it. If you want to add markers to the series you have to set a few properties in advance. For example if you want to show 10 markers along the whole line (with equal distances) do the following:
chartWrapperObj.AddMarkers = true; // it is by default true though
chartWrapperObj.MarkerCount = 10;
Or if you want to show a marker after every 200 data points do the following instead:
chartWrapperObj.AddMarkers = true;
chartWrapperObj.MarkerFreq = 200;
Anyway if you miss the underlying chart control, you can have a reference to it and perform your own customizations:
var msChart = chartWrapperObj.TheChart;
Even easier, if you want to show a chart in a separate window, just as easy as you pop a `MessageBox`, try the static methods of the `ChartForm` class. For example, showing a chart window with two line series (say `ser1`, and `ser2`) is as easy as the following method call:
ChartForm.ShowLineChartForm(
new[] { "Firs Series", "Second Series" }, new[] { ser1, ser2 },
"Comparing the series", "x", "value", "Line Chart Window Demo");
# Nuget
Along with its [Github page](https://github.com/sinairv/MSChartWrapper), you can also install *MSChartWrapper* through [Nuget](https://nuget.org/packages/MSChartWrapper/):
Install-Package MSChartWrapper
# Screenshots
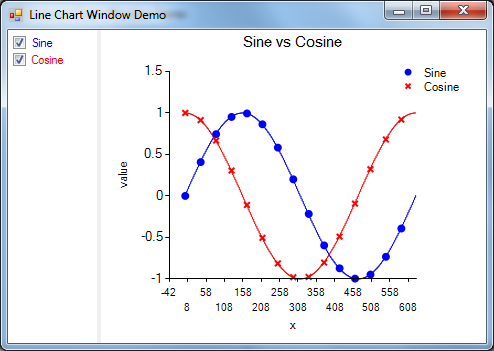
A simple line chart:
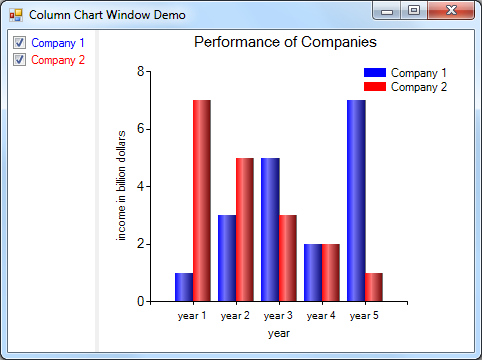
A simple column chart:
Highlighting the UI features:
# License
MIT
本源码包内暂不包含可直接显示的源代码文件,请下载源码包。